Math & ModelsUpdated 21 Jul 20266 min read
Elo Ratings
Every team carries one number. The gap between two numbers says what the result should be, and after the match the winner takes points off the loser — more of them the more surprising the result was.
Elo was built for chess in the 1960s and has since been bent to fit almost every competitive sport. The core is simple enough to run on paper, which is part of why it has lasted, and why it is still worth understanding before you look at anything more elaborate.
Turning a rating gap into an expected result#
The only formula that matters. If your team is rated D points above the opponent, the expected score is:
E = 1 ÷ (1 + 10 to the power of (−D ÷ 400))
The 400 is a scaling convention, nothing more: it is chosen so that a 400-point advantage corresponds to winning ten times as often as losing.
| Rating advantage | Expected score | Reads as |
|---|---|---|
| 0 | 0.500 | level |
| +100 | 0.640 | clear favourite |
| +200 | 0.760 | heavy favourite |
| +400 | 0.909 | mismatch |
That distinction in the caption trips people up constantly. An expected score of 0.640 does not mean a 64% chance of winning. It means that across many repetitions, this team averages 0.640 of the available result — which could be 64% wins and 36% losses, or 45% wins, 38% draws and 17% losses. Elo alone cannot tell you which.
The update: the winner takes points from the loser#
After the match, each rating moves by:
new rating = old rating + K × (actual score − expected score)
Actual score is 1 for a win, 0.5 for a draw, 0 for a defeat. Take the favourite from the table above — rated 100 points higher, expected score 0.640 — and set K = 20:
The underdog gets the exact mirror image: −7.2, +2.8, +12.8. Nothing is created or destroyed, which means the average rating across a closed league never drifts.
Notice what this buys you. Beating a team you were expected to beat barely moves you. Beating one you were expected to lose to moves you a lot. The system rewards surprise, not victory, and that is what stops a good side inflating its rating by farming weak opposition.
Notice also what it ignores. Winning 5-0 and winning 1-0 produce identical updates. That is a deliberate choice, not an oversight — more on it below.
The K-factor: how fast ratings move#
K is the only real tuning knob, and it sets a trade-off you cannot escape.
A large K makes ratings sprint after recent form. A team that wins four in a row climbs fast, which is useful if they genuinely have improved and actively harmful if they have merely had four kind fixtures. A small K produces stable ratings that describe a team's strength over a long horizon, but takes half a season to notice that a squad has been gutted or rebuilt.
There is no correct answer, only a fitted one: you choose K by asking which value would have produced the most accurate forecasts historically, and you check it with Brier score rather than by eye. Football implementations commonly land somewhere around 20, and sometimes vary it by competition — a friendly should shift a rating less than a cup final.
What football needs that chess never did#
Two additions, both unavoidable.
Draws. Chess has them too, but football has far more, and the market you are pricing has a separate draw line with its own price. Getting from an expected score of 0.640 to three probabilities requires a second model: the expected score fixes the balance between home and away, and a draw model decides how much of the middle to carve out. Draws are most likely when two teams are close and least likely when the gap is wide, so the width of that middle band has to shrink as the rating difference grows. Every football Elo you have seen makes some assumption here, and it is where implementations differ most.
Home advantage. Chess is played on a neutral board. Football is not, and the effect is large enough that ignoring it makes a rating system useless. The standard fix is to add a constant to the home side's rating before computing the expected score — a bonus fitted from data rather than assumed, and one that varies by league and era. Our guide to home advantage works through how large the effect is and why it shrank in the crowd-free matches of 2020.
What Elo sees, and what it cannot#
Elo's strength is that it uses only results, which makes it remarkably hard to fool. A team that wins 6-0 once and 1-0 four times gets the same credit as a team that wins 2-0 five times, and that is correct: scorelines are noisy, and margin of victory in football carries less information than people assume. Elo also carries strength forward indefinitely, so it knows a promoted side is weak before that side has played anyone.
The limits are just as clear. Elo has no concept of goals, so it cannot price over/under, both teams to score, or anything else about the shape of a match — only who wins. It knows nothing about how a win was earned, so a side winning repeatedly on late deflections looks identical to one winning comfortably. And it treats a team as one number, which means a squad with a brilliant attack and a leaking defence is compressed into the same scalar as a balanced side of equal record.
That is precisely why it belongs alongside a goals model rather than instead of one. A Poisson or Dixon-Coles model starts from scoring rates and can price the whole grid; Elo starts from results and is the better judge of raw strength. They fail in different directions, which is the entire argument for running both.
Elo inside Tofiko#
Tofiko runs two model families side by side — the goal-based pair and Elo — and blends them. When they disagree, the match page says so.
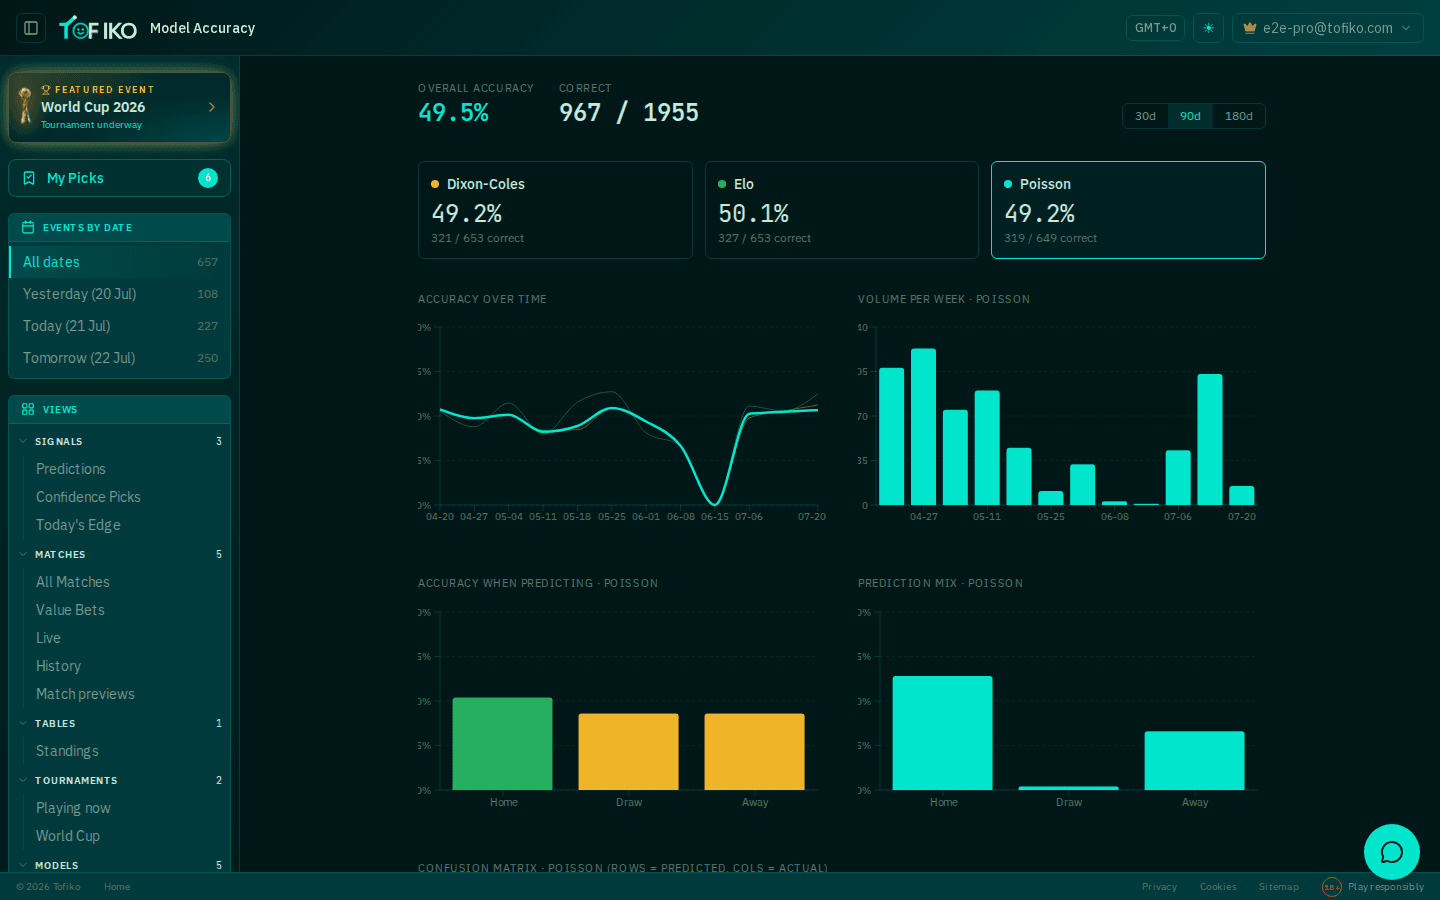
On that screen Elo has been the strongest of the three on raw 1X2 accuracy. Two caveats, and both matter more than the ranking does.
First, it is an accuracy figure, not a profit figure. Picking the most likely outcome slightly more often than another model says nothing about whether either could beat a price. Tofiko's published record shows no demonstrated edge over closing prices, and the Elo column does not change that.
Second, the gap is not big enough to mean anything yet. The standard error on an accuracy figure drawn from 653 matches is about two percentage points, and the spread between best and worst here is 0.9. Which is why the pages worth reading are calibration and Brier score, not the leaderboard — and why we grade the models on those instead. If you want to check what an Elo-derived probability implies as a price, or strip the margin from the market's version before comparing, the fair odds calculator below does both.
| Outcome | Raw 1 ÷ odds | Naive (proportional) | Fair (power) | Fair odds |
|---|---|---|---|---|
| Home | 50.0% | 48.4% | 48.9% | 2.04 |
| Draw | 29.4% | 28.5% | 28.3% | 3.53 |
| Away | 23.8% | 23.1% | 22.8% | 4.39 |
Power = the margin-removal method Tofiko uses everywhere (validated on 43,000+ closing books). It takes proportionally more off longshots, matching how bookmakers actually load the margin.
Related
- How Our Models Work: Poisson, Dixon-Coles and Elo
- The Poisson Distribution: Turning Expected Goals Into Scorelines
- The Brier Score: How We Grade Our Own Predictions
- Calibration: The Only Promise a Prediction Can Keep
- Home Advantage: How Much It's Worth and How Models Price It
- Fair Odds Calculator — Remove the Bookmaker Margin from Any 1X2 Book
- Odds Converter — Decimal, Fractional, American & Implied Probability
- Poisson Calculator — Scoreline, 1X2, Over/Under & BTTS Probabilities
Frequently asked questions
How does the Elo rating system work?
Every team holds a single rating. The difference between two ratings implies an expected score for the match. After the game the ratings move by K times the gap between the actual result and that expectation, so the winner gains exactly what the loser gives up.
What is the K-factor in Elo?
K controls how far a rating moves after one result. A high K makes ratings react quickly to recent form but leaves them jumpy; a low K makes them stable but slow to notice a genuinely changed team. Football implementations typically sit in the region of 20, fitted rather than assumed.
Why does football Elo need a draw adjustment?
Because the standard formula returns an expected score, not a win probability, and it treats a draw as half a win. Around a third of league matches are drawn, so a football version has to split that expected score into separate home, draw and away probabilities before it can price the 1X2 market.
Is Elo better than a goals model for football?
They measure different things. Elo tracks long-run strength from results alone and is very hard to fool with one freak scoreline; a goals model estimates scoring rates and can therefore price totals, both-teams-to-score and correct score, which Elo cannot address at all.