startUpdated 22 Jul 20265 min read
Reading a match row
One row on the All Matches list carries more information than any other element on the site. Once you can read it left to right, most of Tofiko stops needing explaining.
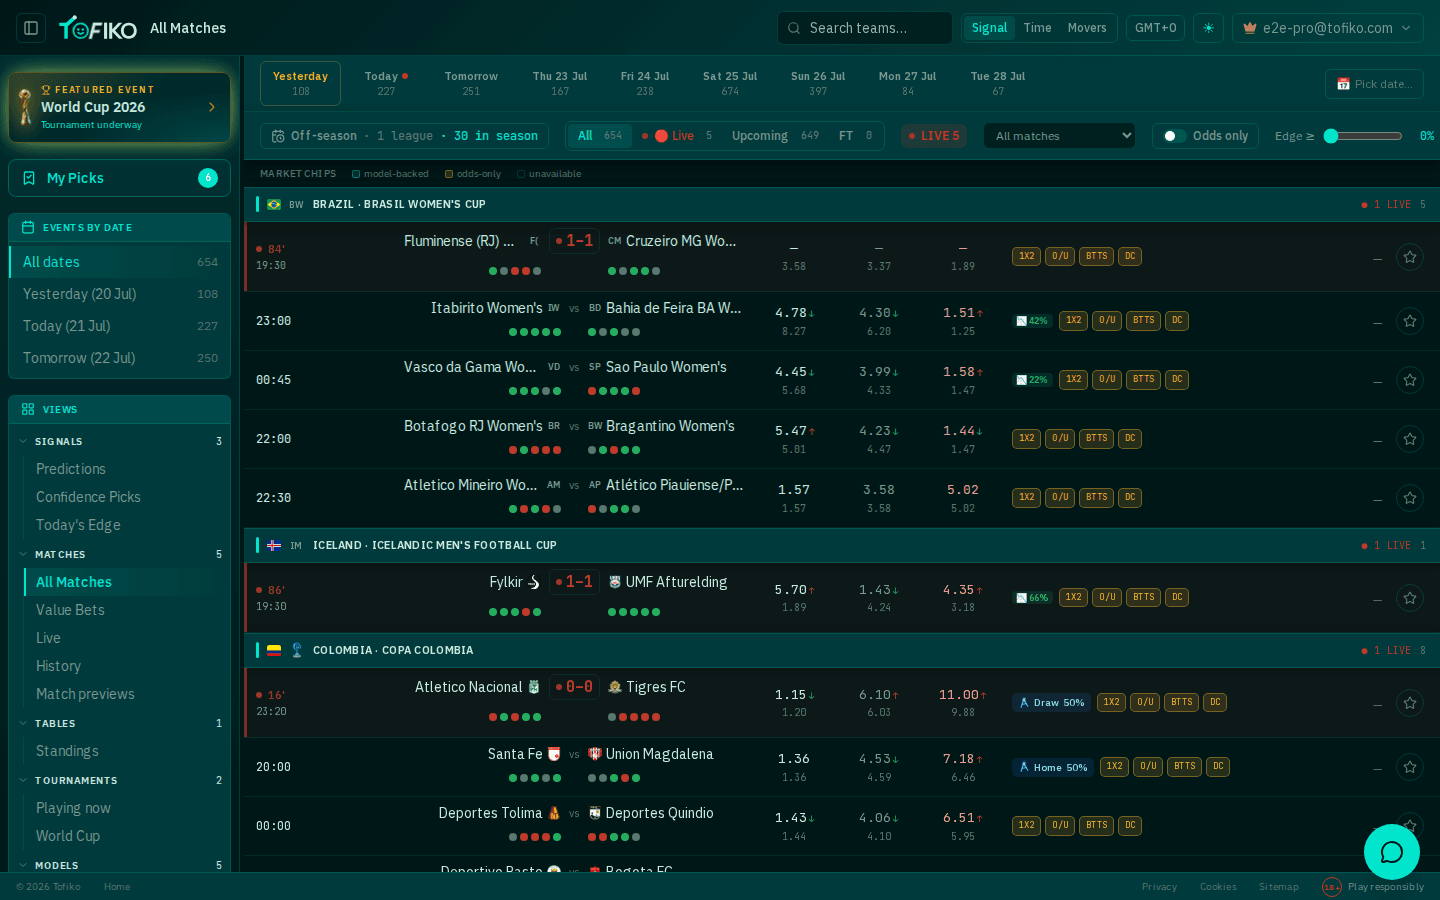
Kick-off time, or the live minute#
The first thing in the row is when the match starts, shown in the timezone you picked in the top bar. Set that once and every time on the site follows it.
If the match is in play, that slot shows the live minute instead. Rows are grouped by country and competition, so the row's league is the heading above it rather than part of the row itself. The status filters — All / Live / Upcoming / FT — decide which rows you're looking at, and the live count next to them tells you if anything is running right now.
Teams, short codes and the five form dots#
Both teams appear with a short code alongside the full name — useful when a list is dense and names are long.
Next to each side sit five form dots: the team's last five results. They're there for scanning, not for deciding. Five matches is a tiny sample, and a team can lose four narrow games to good opponents and be underrated by everyone reading the dots. Treat them as context, and let the probability do the work. How many bets it takes to know anything is a useful corrective here.
The three odds columns#
Then come three price columns — home, draw, away — the classic 1X2 market. If the three-way market is unfamiliar, the match result guide covers it properly.
Two details make these columns more useful than a plain price list:
- The previous price sits underneath the current one. You can see where the market was as well as where it is.
- An ↑ or ↓ arrow marks the direction of travel. Up means the price has lengthened since it was last recorded; down means it has shortened.
The arrow is not a prediction. It is a record that the market changed its mind — money came in, news landed, a line-up leaked. Because the market is a well-informed forecaster (on 1X2 it is currently ahead of our model), a price moving against your selection is genuine information that you may be on the wrong side. That is the whole logic behind closing line value: beating the price the market settles on is the cleanest evidence a method is working.
To turn any of these prices into a probability, divide 1 by the decimal odds — or drop it into the odds converter and read every format at once. Comparing that implied percentage to the model badge is the core move on this whole site.
The model probability badge#
Some rows carry a probability badge — a bare percentage such as "42%", or a named selection such as "Home 50%" or "Draw 50%". That is the model's estimate for that outcome, produced by our Poisson, Dixon-Coles and Elo ensemble.
Not every row has one, and that's expected. The odds come from the market; the probabilities come from our models; the two do not cover the same set of leagues. When a fixture is priced but not modelled, the row simply has no badge.
Two things worth keeping in mind when you read a badge:
- A model percentage is not a tip. It is one estimate to set against the price's implied percentage — the comparison that defines value betting.
- Margin-free market percentages, edges, expected goals, fair odds and the score matrix are part of the PRO analytics layer rather than the row itself. Plans and billing sets out which tier shows what.
Market chips and the legend#
At the end of the row sit the market chips — 1X2, O/U, BTTS and DC — showing which markets exist for that fixture. The legend above the list explains their three states:
- Model-backed — we have both a price and a model probability. This is the row you can actually reason about.
- Odds-only — the market prices it, the model doesn't cover it yet. Read the price, expect no percentage.
- Unavailable — no market for that fixture at the moment.
Reading the chips before you read anything else saves time: if the chip you care about is odds-only, there is no model number coming further along the row.
The save button#
Last in the row is a save/star button. It keeps the fixture to hand for later.
Saving is not betting and it is not logging. To record an actual stake and price you use + Log a pick in My Picks, which is free on any account and is what feeds your bankroll, ROI and open-bets list. Use the star for "look at this again", and the tracker for "I have money on this".
If you want to narrow the list down before you start reading rows at all — by league, by odds availability or by minimum edge — finding matches covers the filters, and the full fixture list lives on the predictions pages.
Related
- Getting started with Tofiko
- Finding matches on the All Matches screen
- My Picks: your betting workspace
- Plans and billing
- 1X2 Explained: Football's Default Market, and the One Bookmakers Price Best
- Fair Odds: What the Bookmaker's Margin Hides
- Closing Line Value: The Only Scoreboard That Answers in a Season
- What Is Value Betting? A Plain-English Guide
Frequently asked questions
What do the up and down arrows next to the odds mean?
They show that the price has moved since it was last recorded, and in which direction. The previous price is printed underneath the current one. A shortening price means money has come in on that selection; a drifting price means the opposite.
Why does this match have odds but no model percentage?
Because the model doesn't cover that league yet. Odds come from the market, probabilities come from our models, and the two have different coverage. Those rows are marked odds-only in the market chips legend.
What are the five dots next to each team?
The team's last five results, most recent at one end. They are quick context for scanning a list, not a model input you should bet on by themselves.
What does the star button do?
It saves the fixture so you can come back to it. Saving a match is not the same as logging a bet — to record a stake and a price you use + Log a pick in My Picks.