modelsUpdated 22 Jul 20265 min read
How to read the Performance page
The Performance page grades the models, not your bets. It answers one question: how good are these probabilities, judged against the market and against what actually happened? It is deliberately unflattering.
Performance measures probability quality. It does not show profit, and it never grades on ROI. The scoring is Brier, calibration and closing-line value — measures that cannot be inflated by a lucky month.
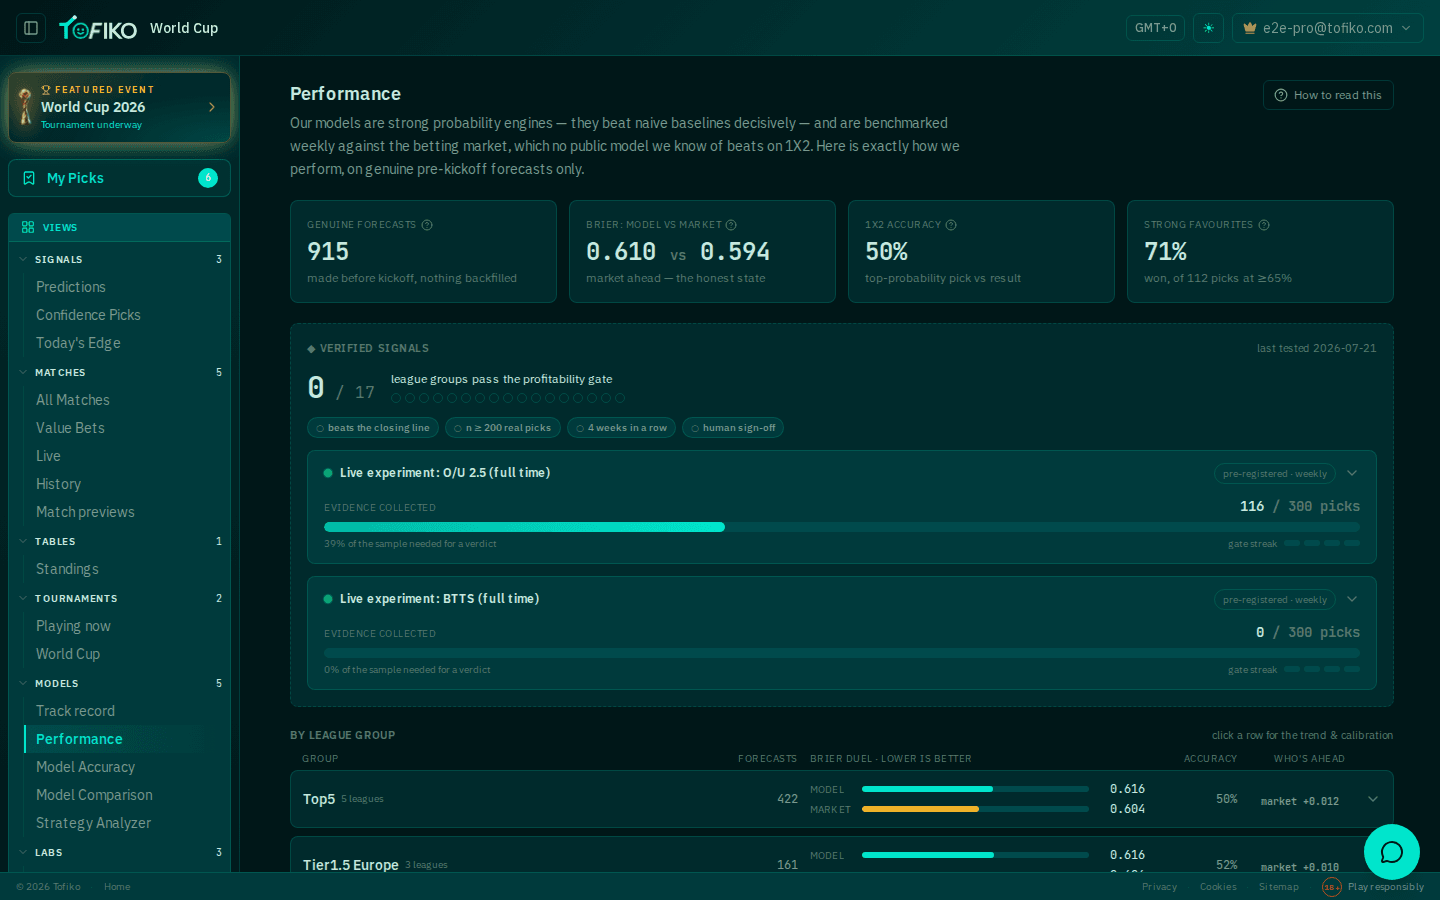
The four headline tiles#
Genuine forecasts — 915. This is the most important number on the page, and the least exciting. It counts only forecasts made before kick-off. Nothing backfilled is included.
That distinction is the whole point. A model scored against matches whose results were already known will look brilliant, because information from the result leaks into the forecast. Backfilled history produces impressive numbers that vanish the moment the model faces a fixture it has never seen. So the honest count is small — 915 — rather than large and meaningless.
Brier: model vs market — 0.610 vs 0.594. Brier score measures how close probabilities land to reality, and lower is better. The market's 0.594 beats the model's 0.610. The tile is labelled "market ahead — the honest state", because that is exactly what it is. Brier score explained covers how the number is built.
1X2 accuracy — 50%. How often the highest-probability outcome won. Useful context, but a weak measure on its own: a model that only ever picked short favourites would score higher and still be worthless. Accuracy tells you nothing about whether the price was right.
Strong favourites — 71%. Of 112 picks priced at 65% or higher, 71% won. That is roughly what a well-calibrated model should do: when it says 65-plus per cent, it should be right about that often.
The verified signals block#
Below the tiles: 0 of 17 league groups pass the profitability gate.
Zero. That is the current state, published rather than hidden. A league group is only marked verified when it clears all four criteria chips at once:
- Beats the closing line — the model's picks are priced better than the market's final price. Closing line value is the least fakeable evidence of an edge that exists.
- n ≥ 200 real picks — pre-kickoff picks only. Below that, results are noise wearing a costume.
- 4 weeks in a row — one good fortnight is variance, not a signal.
- Human sign-off — a person reviews it before it is published as verified.
All four, or nothing. A group that beats the closing line on 40 picks does not qualify.
The live experiments#
Two pre-registered experiments run with progress bars:
- O/U 2.5 (full time) — 116 of 300 picks collected.
- BTTS (full time) — 0 of 300.
Pre-registration means the success criteria and the sample size were fixed and published before the picks were logged. This matters more than it sounds. Without it, anyone analysing results can quietly choose the cut-off, the market or the date range that flatters them — and will usually do so without noticing. A bar that reads 116/300 is a promise not to draw a conclusion yet. Read how many bets you actually need if 300 sounds arbitrary.
The by-league-group table#
The table breaks everything down by group — Top5, Tier 1.5 Europe, and so on — with the forecast count, a model-vs-market Brier duel bar, accuracy, and a "who's ahead" column.
Read it in this order:
- Forecast count first. A group with a handful of forecasts tells you nothing, however good the duel bar looks.
- Then the duel bar, which shows whether the model or the market scored the better Brier.
- Ignore any group that wins narrowly on a small sample. That is the trap the table is designed to expose, not to sell.
The How to read this button at the top right of the page repeats the essentials in place.
How to use the scepticism#
A site that publishes "the market is ahead of us" is handing you something a tipster never will: a measuring stick you can hold up against its own claims. Use it.
- Treat the model as a second opinion, not an oracle. On 1X2 the market is currently the sharper of the two.
- Watch the gap over time. If the Brier duel narrows across successive weeks, something real is improving. A single good week is not that.
- Demand the same standard elsewhere. Any source that shows profit but never a calibration or closing-line number has chosen the measure that flatters it.
- Check the run of actual forecasts separately on the track record page — Performance grades the probabilities, track record shows the picks themselves.
- Test ideas before trusting them in the Labs, and remember that a backtest is not evidence of a live edge.
Nothing here means the models make money. Zero of 17 groups pass the gate, and no ROI figure on this site should be read as proof of quality. Treat every number as a measurement, not a recommendation.
Related
- The Track record page
- Labs: Strategy Lab, Backtest and Bankroll Lab
- Where the data comes from and how often it updates
- The Brier Score: How We Grade Our Own Predictions
- Calibration: The Only Promise a Prediction Can Keep
- Closing Line Value: The Only Scoreboard That Answers in a Season
- Sample Size: How Many Bets Before You Know You Have an Edge
Frequently asked questions
Why does Tofiko say the market is ahead of its own models?
Because on 1X2 it currently is. The model's Brier score is 0.610 against the market's 0.594, and lower is better. Publishing that is the point — a number you can check is worth more than a claim you can't.
What does 'genuine forecasts' mean on the Performance page?
It counts only forecasts recorded before kick-off. Backfilled history — predictions generated after the result was known — is excluded entirely, because it always looks better than it deserves to.
Why do 0 of 17 league groups pass the profitability gate?
None of them has yet met all four criteria at once: beating the closing line, at least 200 real picks, four consecutive weeks, and a human sign-off. Until a group clears all four, it is not marked as verified.
What is a pre-registered experiment?
The rules for judging it are written down and published before the data is collected. That stops anyone, including us, from moving the goalposts once results start arriving.